Last year, after halting the NHL season in March due to the COVID-19 pandemic, the league eventually decided to resume play in “bubble” format, with a total of 24 playoff-eligible teams being split into two 12-team groups. Games for the Western Conference teams would be played at the Oilers’ rink in Edmonton while games for the Eastern conference (and Stanley Cup Finals) would be played at the Maple Leafs’ rink in Toronto.
This exceptional situation led me to start wondering about the nature of home-ice advantage. For example, both the Edmonton Oilers and Maple Leafs were among the 24 playoff-eligible teams (with both teams playing in a best-of-five qualifying series) and would be playing in their respective home rinks. However, because of the pandemic, these games would be played without any audience (with the minor exception of staff and players from other teams). Further complicating the matter, in the NHL, home teams are granted the “last change” (i.e., the ability to wait to select which players they want to send out during a stoppage in play until after the away team selects their players). This advantage is completely unrelated to the crowd or the location.
In the end, both the Edmonton Oilers and Toronto Maple Leafs had early exits from the bubble, with both teams losing their best-of-five qualifying round series (3-1 for the Oilers and 3-2 for the Maple Leafs). Interestingly, this was despite each of the teams having home-ice advantage (both in terms of playing all of their games in their actual home rink and being the home team for at least half the games played in the series). Unfortunately, by themselves, these two series only provide a very small sample of games and I am unable to envision a way that they could provide any statistically significant insights on home advantage.
Despite the end result, however, it did lead me to consider a number of hypotheses concerning the actual cause of home-ice advantage. That is, what aspect of being the home team actually gives a team an advantage. Does the home team’s ability to better assign match-ups give them a significant advantage to control the game? Do the cheers and support of the home team’s fans encourage them to play better? Are the refs persuaded by the home team’s fans’ pleas to call penalties on the away team? Or perhaps it’s the “helpful” reminders from the home team’s fans to shoot the puck, particularly on the power play? Are the players on the away team fatigued from their travels? Or could it be that the home team players are more familiar with the idiosyncrasies of their home rink, such as any quirks in how the puck plays off of the boards, glass, or dividers? Even based on my own experiences at beer league hockey, at certain rinks I might try to avoid (if possible) playing the puck by the ice resurfacer doors due to the ice sloping steeply down towards the boards and the expression “digging for the puck in the corner” feeling more literal than figurative.
Before I get too far ahead of myself and get lost in posing too many complicated questions at once, there are much simpler and more obvious questions that we should really consider first. Specifically, is there actually a home advantage in the NHL? And if so, how significant is it? Has it changed over time?
We can actually study these questions in a rather straight-forward manner using statistical hypothesis testing. A simple way to test this hypothesis therefore is to take a large sample of game results and calculate how assigning teams to a home or away “treatment” affects the winning percentage for each group and comparing. If a home team does indeed have some sort of advantage, we can expect them to win more games than away teams. If there is no advantage for the home team, the percentages should be roughly equal.
One possible confounding factor that one might consider, however, is that the quality of the team should be the primary deciding factor in a game result. While this is true, in a normal NHL season, half of each team’s games are played at home and half are away. If you randomly pick two teams and randomly assign them to home or away “treatments”, on average, half of the time the home team will be the better team and half of the time the away team will be the better team. Thus, if the better team always won the match-up, the winning percentage would be split evenly between home and away (the same is also true if a random team won each game). As a result, statistically significant deviations from an even split of home/away teams winning can be attributed to one of the teams having an advantage.
Another related caveat to consider, however, is if there is any bias in how teams are assigned to the home and away “treatments”.1 Though each teams plays half of their games at home and half away, as in most sports, teams in the NHL with better records during the regular season are given “home advantage” in the playoffs. That is, in a playoff series the teams with better records will play at least 50% of their games at home, while the teams with worse records will play at most 50% of their games at home. As a result, for this analysis, only regular season games are considered when calculating home advantage.2
One last factor to consider is ties. Over the history of the NHL, there have been multiple rule changes regarding how games tied at the end of regulation and overtime are handled. In this basic analysis, I excluded tie games from consideration (i.e., they do not count as wins for the home or away teams). Overtime/shootout wins and overtime losses are categorized as wins and losses, respectively in this analysis, though I plan to consider this in a future post.
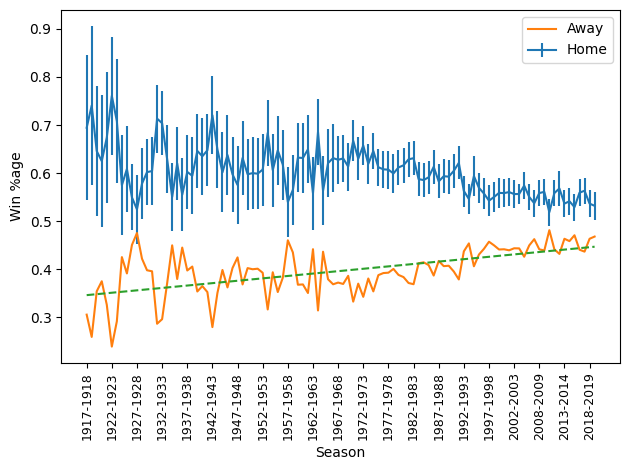
The above graph shows the win percentages for the home and away teams each season since the league’s beginnings in 1917. Tie games are excluded from the dataset. As a result, the two lines are showing complementary information, but I will use each line to show different trends. The error bars on the Home line represent the 95% confidence interval (CI) for a binomial probability and the dashed green line overlaying the Away line represents the linear regression fit.
Over the years, we see that the CI bars are steadily getting narrower, with changes sometimes occurring rather abruptly. In general, this is due to an increase in the number of total games played for during season, either from an increase in the number of games played by each team over the course of a season or from the league adding new team(s).
Though there tends to be some overlap in the CI over the years, it is interesting to me that there is relatively little overlap when comparing the winning percentage in the last 10 years or so to previous decades, particularly the late 1960s through the 1970s, when the league expanded rather quickly. From a quick visual inspection, it does appear that the home-ice advantage is decreasing over the course of the NHL. That said, the wider variance in the early years of the NHL makes it difficult to tell how significant the trend is. However, on the whole it does appear that the home and away winning percentages are trending towards converging around 50% as home-ice advantage becomes less significant.
Interestingly, the linear regression fit line for the away team winning percentage has a slope of about 0.1. Since the y-axis represents the percent of games won, this means that from one season to the next, on average, the away team will win 1 additional game for each 1,000 games played. While this may not seem significant over the course of a few seasons, over the >100 year history of the NHL, this translates to the away team winning an additional 100 games for each 1,000 games played. Overall, according to the linear regression fit line, the away team winning percentage increased from about 35% from the league’s inception to about 45% in recent seasons. The the Pearson correlation coefficient actually suggests a moderate correlation between time and away team winning percentage (r = 0.59).
However, a linear fit may not be the best choice for estimating the relationship between time and home advantage for multiple reasons. First, changes in the league happen rather abruptly. Expansions, such as when the number of teams in the league doubled in 1967, and major rule changes happen between seasons. Another issue is that we don’t expect that this trend will continue in a linear fashion over the next 100 years. If it did, in approximately 50 years, being the home team would actually become a slight disadvantage. In 100 years, away teams would be winning about 55% of the time. Therefore, fitting to an asymptotic function would likely provide a more accurate prediction.
Looking at the graph again, it is interesting to note that from the mid-1960s to the early 1990s, the prediction from the linear fit line for the away team winning percentage is consistently at or above the actual win percentage. From the early 1990s to today, it predicted value is at or below the actual win percentage. This suggests that there may be another function that better fits our data.
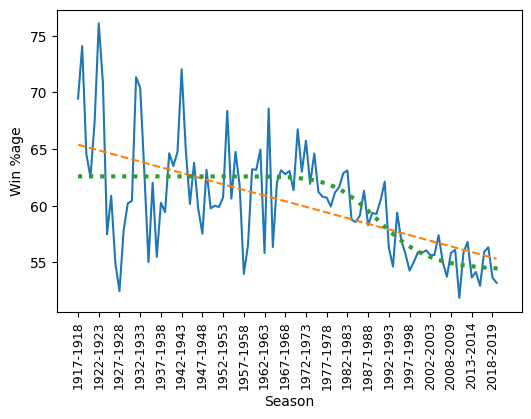
One option that we can try instead is fitting a generalized logistic function, which is better able to fit S-shaped curves. The above graph focuses only on the home team winning percentage, with the dashed orange line representing the linear fit (for practical purposes, the complement of the above fit) and the dotted green line represents the fitted generalized logistic function. Though there is noise in the earlier NHL seasons (likely due to the smaller sample of games played), compared to a linear function, a logistic function appears to be a much better fit for the data.
With this model, it is easier to identify where the change in home-ice advantage is actually taking place. The generalized logistic function is able to identify two asymptotes, one at each end of the S-curve. The left asymptote is at approximately 62.6%, while the right asymptote is at 54.4%, again, a change of about 8.2%, which is less drastic of a change than the previous 10%. Based on our new model, it actually looks like the benefits (in terms of games won) of home-ice advantage stayed fairly consistent throughout the NHL’s pre-expansion era. However, by the early 1990s, home-ice had become significantly less advantageous, though this downward trend appears to be leveling off over the last two decades.
In future posts, I am planning to explore what changes/factors may have played a role in the change, though identifying any single change may be difficult. In my research involving Internet measurements, one of my interests has been well-designed “natural experiments”, which are particularly useful when proper randomized controlled trials are not feasible. I am currently planning to use data on the 2020 NHL playoff bubble and the 2021 NHL season (along with any neutral site and outdoor games) to see if it is possible to isolate the benefits of multiple confounding factors that could contribute to “home advantage”.
I am also planning to considering grouping seasons into different eras of home advantage, particularly so I can create larger sample sizes of games in the pre-expansion era. In addition to the effects that rule changes may have had on home advantage, another possible factor may have been a trend of ice rinks becoming more consistent across the league from the 1970s onward. Another factor I am planning to explore is the impact of travel, the effects of which may have been reduced following the popularization of air travel in the late 1950s. I have also had trouble finding details about the history of the “last change” rule. If any readers have evidence of this existing throughout the history of the NHL or when it was added, I’d appreciate any pointers.
-
In this article, I do not discuss the results of my initial binomial distribution hypothesis testing in great detail since they are not by themselves particularly interesting. In summary: home-ice is indeed a statistically significant advantage and yields a very small p-value. The idea of hypothesis testing is mentioned here to introduce language of applying the home/away “treatments”. The main goal of this post is to focus on understanding the effect size of each treatment over the history of the NHL. ↩︎
-
After doing a bit of quick research, I was unable to find any obvious oddities with how games were scheduled early in the NHL’s history. If any readers are aware of any bias in terms of home/away scheduling (e.g., better or larger market teams getting more games at home) please feel free to reach out. I may update this post after verifying that schedules were fair in this sense. ↩︎